ECONOMIC TRUCKING TRENDS: Trailer orders surprise to the upside, spot rates keeping pace with rising diesel costs
What’s moving higher faster, diesel prices or spot market rates? It depends on the type of freight you’re hauling. More on that later.
First, trailer orders in March surprised analysts with their strength, though they remain well below the 10-year average.
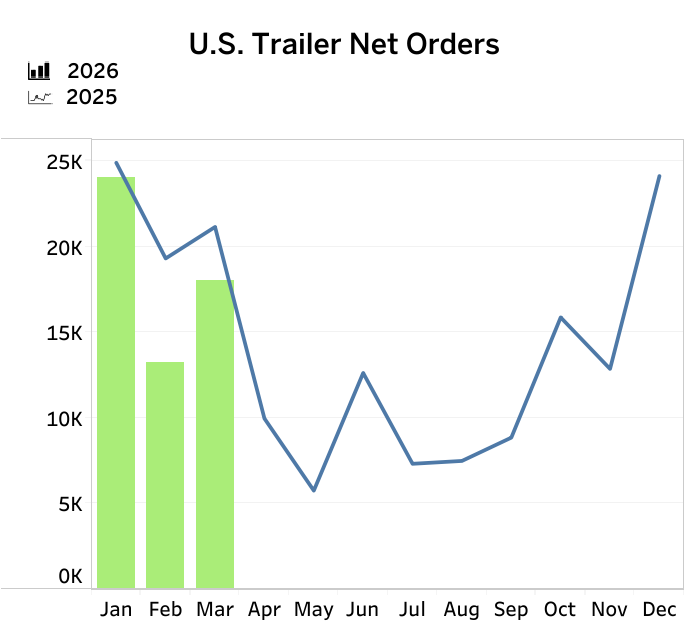
Trailer orders surprise on the upside
U.S. trailer orders were stronger than expected in March at 18,045 units, according to preliminary data from FTR. That’s a 36% gain of February but down 15% year over year.
They continued to come in below the 10-year average of 20,276 for the month. Trailer order season – which runs from September through March – are down 19% compared to the same period last year.
“Despite the healthy increase in orders, trailer demand remains largely replacement driven as fleets still have excess trailer capacity. In contrast, Class 8 demand has strengthened meaningfully, supported by improving asset utilization, firmer rate expectations, and better visibility into tariff-adjusted pricing and EPA27 NOx regulations – all of which combine to drive an early-cycle recovery in orders,” explained Dan Moyer, FTR’s senior analyst, commercial vehicles.
“As a result, fleet capital allocation is increasingly shifting toward power units aligned with forward-looking needs, leaving trailers relatively deprioritized despite improved freight market conditions. Meanwhile, the U.S. trailer market continues to face persistent headwinds. Elevated steel and aluminum costs, ongoing trade uncertainty, high financing costs, and constrained capital spending are limiting incremental demand and keeping orders subdued.”
ACT Research reported 18,800 orders for the month.
“A sequential drop in net orders is typically expected, as March traditionally ushers in the weakest months of the annual order cycle,” said Jennifer McNealy, director, commercial vehicle market research and publications. “That said, this year’s cycle seems to have been delayed a few months, as the order upticks that should have started in September or October of last year didn’t actually happen until December. Regardless the timing, we have entered the period of the year in which trailer makers typically receive fewer orders and start to work down the backlog that grew during peak season.”
Freight recovery underway
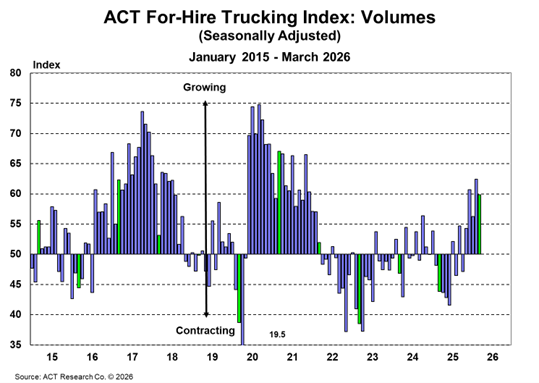
More freight and less capacity combined to tighten the supply-demand balance in trucking, according to ACT Research’s For-Hire Trucking Index.
“In five of the past seven months, the volume index has been above 54, a mark reached just twice in the preceding 42 months,” noted Carter Vieth, research analyst with ACT. “As emphasized by the accelerating decline in the driver availability index and the more chronic decline in the capacity index, this is largely a supply-driven recovery, though lower tariffs may be helping as well. Even as the outlook for goods demand worsens on spiking fuel prices, for-hire demand is supported by declining supply.”
As freight fundamentals improve, Vieth said it’s not easy for capacity to keep pace, as equipment budgets are constrained and driver availability is declining.
The supply-demand balance was tight in February and March, ACT reported.
“We see only part of the recent gains as weather-driven, and the reversal of those gains was interrupted in March by more tightness caused by surging diesel costs. While the economy is likely to remain uneven and effects on inflation and interest rates from the war in Iran curtail the demand outlook, lower tariffs support the outlook to some degree. But capacity continues to exit the market, even with growing prebuy demand ahead of EPA27,” Vieth said.
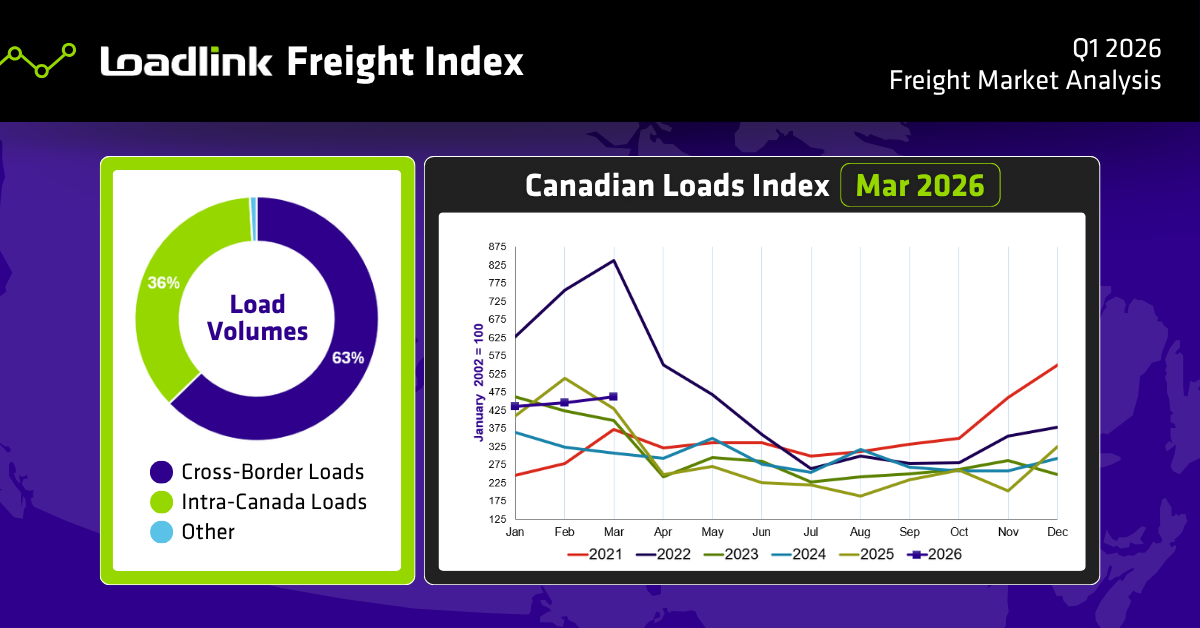
Canadian spot market sees growing freight demand
Loadlink Technologies reports 6% greater freight demand year in March compared to January, while truck counts dropped sharply in February before rebounding in March.
The company says the truck-to-load ratio fell to 1.28 in the quarter, reflecting capacity that outpaced freight growth.
As in the United States, Canada’s spot market saw a surge in flatbed activity, with load postings jumping 36% from January to March. Cross-border loads to Canada jumped 38% from January to February while southbound loads declined about 15%.
Texas emerged as the top U.S. state for cross-border posting activity, Loadlink reported, followed by a cluster of Midwest and Great Lakes states including Ohio, Illinois, and California, reflecting the established north-south trade corridors that connect Canadian industrial centers with major American markets.
Van spot rates stabilized in U.S.
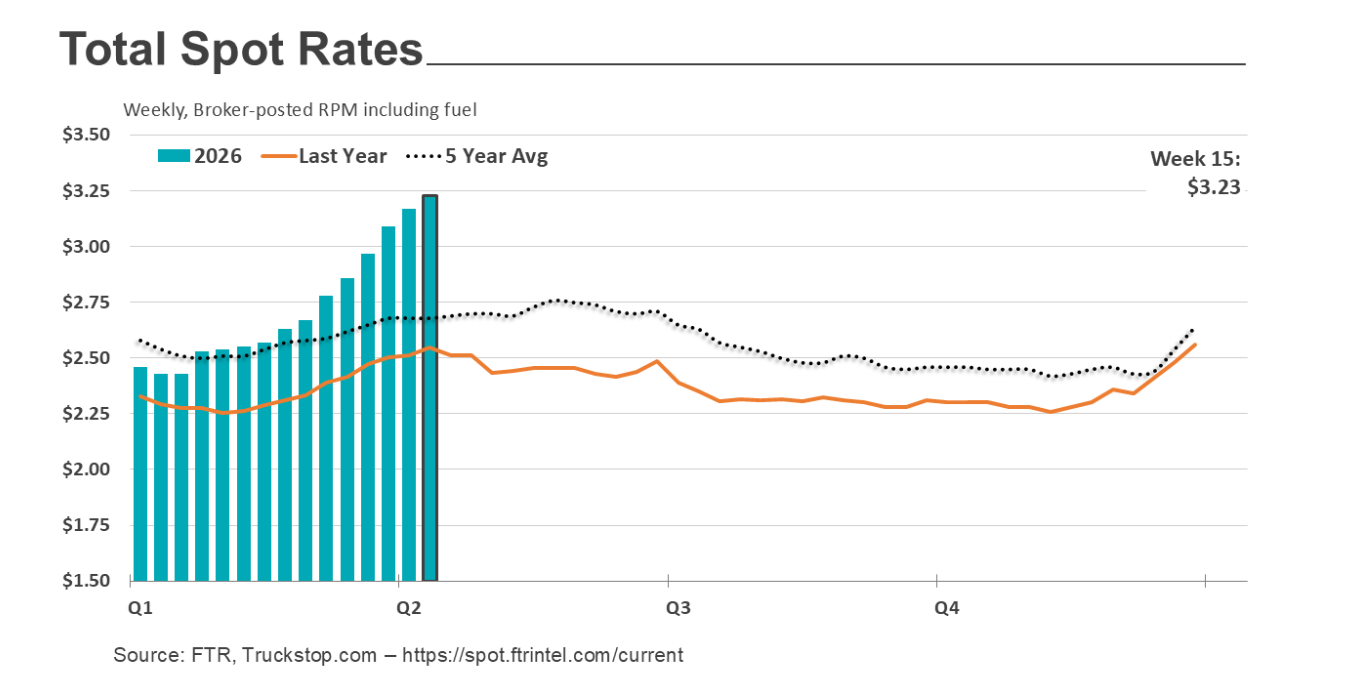
Meanwhile, Truckstop.com and FTR reported broker-posted spot rates rose for the 13th straight week during the week ended April 17, but van and reefer rates were buoyed by surging flatbed rates.
Dry van rates were barely up on the week while reefer rates fell for the second consecutive week.
Total load activity decreased 4.2% on the week, and volumes were down across all three equipment types.
“Truck postings increased 3% week over week, and the Market Demand Index – the ratio of loads to trucks – declined to the lowest level in five weeks after hitting the highest level since February 2022 in the prior week,” Truckstop.com reported.
“Total broker-posted rates were the strongest since June 2022, but rates excluding a calculated fuel surcharge were the strongest since April 2022. Although carriers operating in the spot market typically do not receive surcharges, the calculation is a proxy for the portion of the rate needed to offset higher fuel costs. All-in broker-posted rates were close to 27% higher than in the same week last year while rates excluding a calculated surcharge were up close to 18%.”
Assuming a conservative 6 mpg, carriers’ fuel costs have risen nearly 29 cents/mile since diesel prices began to move upward in response to the conflict in Iran. Dry van rates have climbed by about the same amount, matching – but not exceeding — truckers’ fuel cost increases. It’s a different story for flatbedders; they have seen rates surge 61 cents/mile, more than twice the increase in fuel prices.
Have your say
This is a moderated forum. Comments will no longer be published unless they are accompanied by a first and last name and a verifiable email address. (Today's Trucking will not publish or share the email address.) Profane language and content deemed to be libelous, racist, or threatening in nature will not be published under any circumstances.