Cost to operate a truck hit record $2.34 per mile in 2025, ATRI says

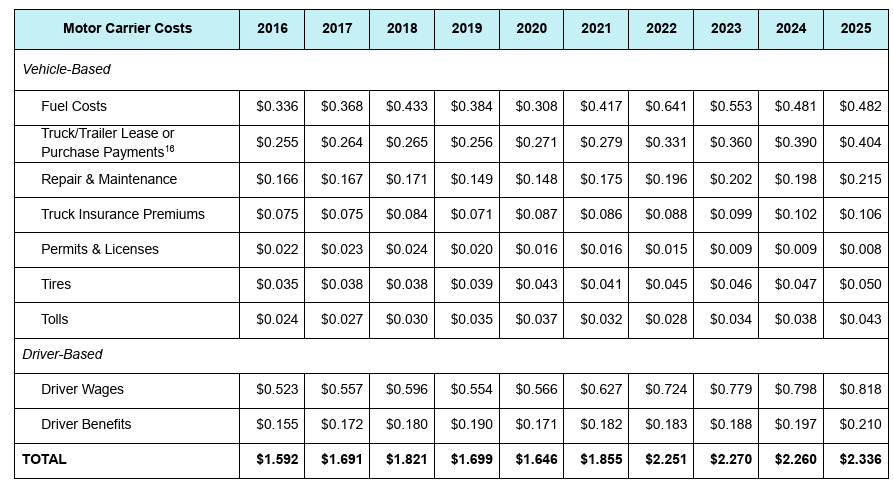
The average cost of operating a truck climbed to a record $2.336 per mile in 2025 as fleets grappled with rising maintenance, toll, labor and equipment expenses while freight rates remained sluggish.
To stay afloat, carriers parked trucks, cut staff, delayed equipment purchases and stretched maintenance cycles in an effort to offset rising costs amid a prolonged freight downturn. This is according to the American Transportation Research Institute’s (ATRI) annual operational costs report released July 15.
Average operating costs climbed 3.4% compared to the year before, marking the highest per-mile cost recorded since the institute began publishing the annual report in 2016. Excluding fuel, costs rose 4.2% to $1.854 per mile, outpacing the broader inflation rate of 2.7%.
“Freight rates are finally turning a corner in 2026, but the acceleration of industry-wide costs means that fleets must continue with aggressive cost discipline,” said Chad Marsilio, chief operating officer of PGT Trucking, in a related news release.
Costs increase in every major line item
There was no single contributor to cost increases in 2025, as every line item aside from permits and licenses increased year over year.
Tolls posted the largest percentage increase of 13.2% to an average of 4.3 cents per mile. Meanwhile, repair and maintenance costs climbed 8.6% to 21.5 cents per mile. ATRI wrote in the report that the increase followed a temporary decline in 2024 and coincided with longer equipment trade cycles and higher truck utilization.
Driver benefits increased 6.6% and tire costs rose 6.4%, all while insurance premiums went up by 3.9%, and truck and trailer lease or purchase payments were up by 3.6%.
Fuel was one of only two major expenses that rose more slowly than inflation, increasing just 0.2%.
Driver wages also increased at a below-inflation rate of 2.5%, although the combined cost of driver wages and benefits surpassed $1 per mile for the first time, averaging $1.028 per mile.
On an hourly basis, trucking costs averaged $106.69, another record for the annual study, up $3.45 from 2024.
Early indicators suggest carriers are unlikely to see much relief in 2026.
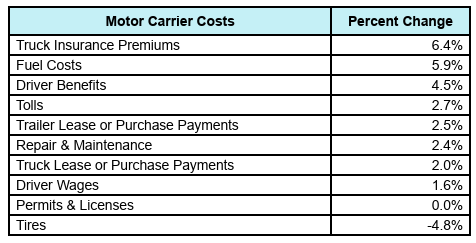
The Q1 data for this year shows that costs rose another 2.2% from the 2025 average. Fuel prices contributed to much of that, with fuel alone at 5.9%, while insurance, tolls, tires, driver wages and benefits also continued to rise.
When it comes to specific sectors, costs increased amongst all for-hire segments in 2025. Less-than-truckload stayed the most expensive in 2025 averaging $2.58 per mile, followed by specialized carriers at $2.39. Truckload fleets continued to have the lowest average operating costs at $2.21 per mile, although their costs still increased 3.8% year over year.
Excluding fuel, it cost LTL fleets $2.12 per mile to operate a truck, compared to $1.85 for specialized carriers and $1.72 for truckload fleets, all increases of 5%, 3.4%, and 3.6%, respectively.
Shrinking capacity
Rather than absorb higher costs, many carriers responded by reducing capacity and cutting expenses.
According to ATRI, motor carriers reduced effective capacity by 5.5% in 2025 via a combination of reducing fleet sizes outright (2.4%) and leaving a significant share of their remaining trucks unseated (10%). This represented the largest reduction in capacity since the freight recession began three years earlier.
Carriers also reduced driver headcount by 6.4% and cut non-driving staff by 7.8%, while increasing equipment utilization and delaying replacement purchases. Hence, older trucks stayed in service longer.
This led to the average tractor age increasing to 3.6 years – the first increase since 2022 – and annual mileage climbed to 85,991 miles, reversing several years of declining utilization. Trucks were driven an average of 250 days during the year.
ATRI also found carriers extended truck replacement cycles to an average of seven years and roughly 634,000 miles before replacement.
The average age of most trailer types, meanehile, was lower in 2025 than in 2024, not because of an uptick in trailer replacement but because fleets operated fewer trailers and, in doing so, retired older trailers sooner.
Thin margins
Despite all the cost-cutting, profitability remained weak across much of the industry.
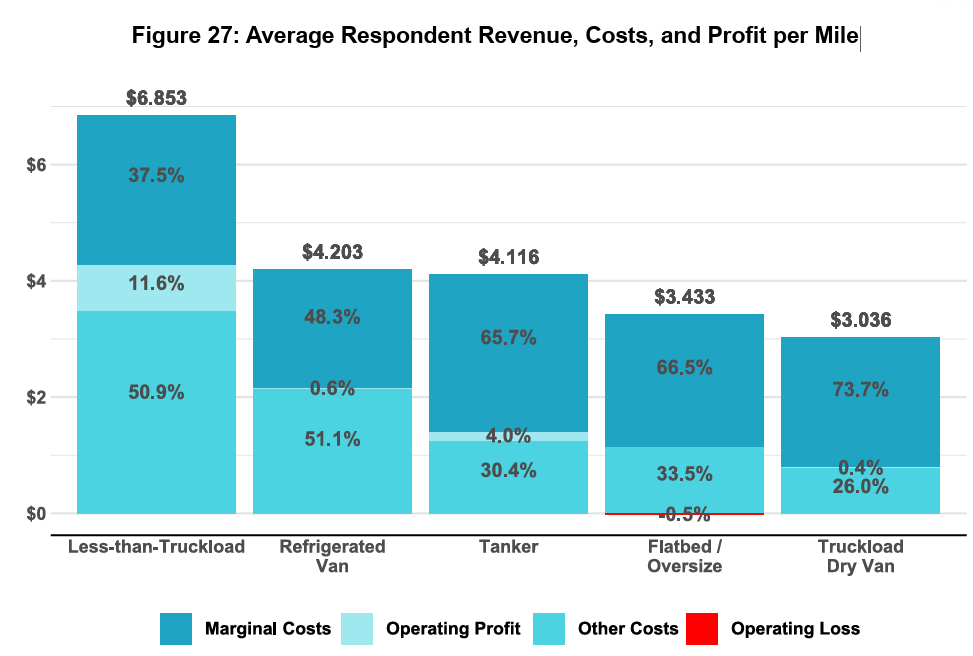
Truckload carriers posted an average operating margin of just 0.4%, while refrigerated fleets averaged 0.6%, both improving modestly from 2024 but remaining below 1%.
Flatbed carriers, however, reported an average operating loss of 0.5%.
Tank fleets generated healthier returns, averaging a 4% operating margin, while less-than-truckload carriers remained the industry’s strongest performers with an 11.6% margin.
Insurance, litigation remain a concern
For the first time in the report’s history, ATRI also researched three areas that have become increasingly important to fleet operations: litigation expenses, in-cab technology spending and hours-of-service utilization.
The institute said the new data will help fleets compare their performance against industry peers while providing greater insight into legal exposure and operational efficiency.
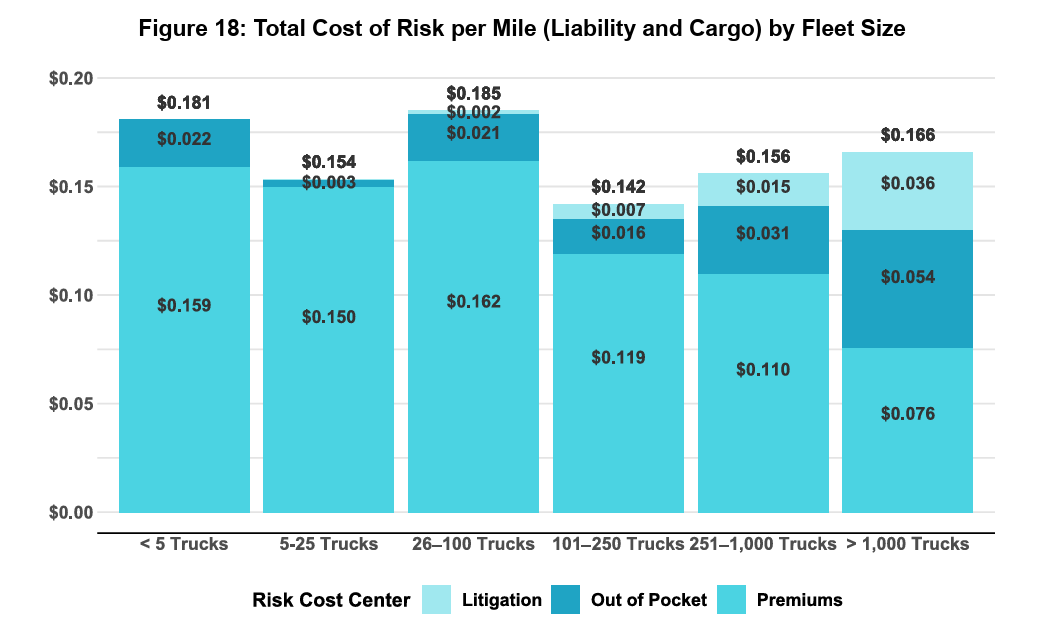
One of the most significant additions is litigation expense, which ATRI now includes alongside insurance premiums to calculate a fleet’s total cost of risk. The report found that while larger carriers typically pay lower insurance premiums per mile than smaller fleets, they incur substantially higher litigation costs. Fleets operating more than 1,000 trucks spent an average of $0.036 per mile on litigation expenses alone, including verdicts, settlements and legal defense costs.
The report also established new benchmarks for hours-of-service utilization. Across the industry, drivers averaged 7.41 hours of driving per day out of the available 11 hours, and 10.4 hours on duty out of the maximum 14-hour workday. This includes pretrip/post-trip inspections, any vehicle fueling/servicing, shipper interactions, and breaks as well as drive time. Truckload and specialized carriers recorded the highest average driving time at 7.97 and 7.95 hours, respectively, while LTL drivers averaged 5.98 hours.
To read the full report, click here.
Have your say
This is a moderated forum. Comments will no longer be published unless they are accompanied by a first and last name and a verifiable email address. (Today's Trucking will not publish or share the email address.) Profane language and content deemed to be libelous, racist, or threatening in nature will not be published under any circumstances.

We need min freight rates as see the most unsafe trucks on the road ever. E_ logs have not made the trucks safer and caused more drivers to rush with current low rates.