New Jersey intersection is top freight bottleneck in U.S.
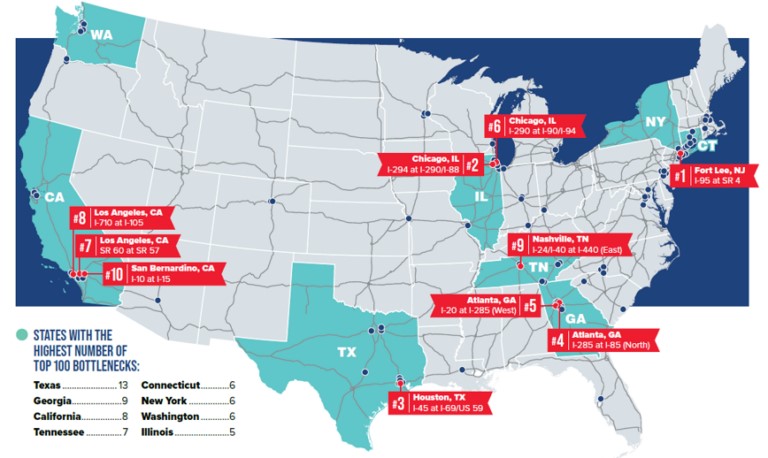
For the fifth year in a row, the intersection of I-95 and SR 4 in Fort Lee, N.J., is once again the Number 1 freight bottleneck in the U.S.
The American Transportation Research Institute (ATRI) has released its 12th annual list highlighting the most congested bottlenecks for trucks in America. The 2023 Top Truck Bottleneck List measures the level of truck-involved congestion at more than 300 locations on the national highway system.
The bottleneck locations detailed in this latest ATRI list represent the top 100 congested locations, although ATRI continuously monitors more than 300 freight-critical locations.
The remaining Top 10 bottlenecks include:
2. Chicago: I-294 at I-290/I-88
3. Houston: I-45 at I-69/US 59
4. Atlanta: I-285 at I-85 (North)
5. Atlanta: I-20 at I-285 (West)
6. Chicago: I-290 at I-90/I-94
7. Los Angeles: SR 60 at SR 57
8. Los Angeles: I-710 at I-105
9. Nashville: I-24/I-40 at I-440 (East)
10. San Bernardino, California: I-10 at I-15
ATRI’s analysis, which utilized data from 2022, found traffic conditions continue to deteriorate from recent years as more Americans returned to work post-pandemic. Consequently, supply chain bottlenecks occurred throughout the country. Average rush hour truck speeds were 36.3 miles per hour, down more than 6% from the previous year. Among the Top 10 locations, average rush hour truck speeds were less than 30 mph.
“The past year-plus has shone a spotlight on our supply chains, and how congestion and other pressures can hurt the American economy and consumers,” said American Trucking Associations president and CEO Chris Spear. “ATRI’s bottleneck report highlights the areas of our transportation network in need of investment so we can get goods and people moving. The cost of doing nothing is felt in needless delays, wasted fuel and time.”
The analysis, based on an extensive database of freight truck GPS data, uses several customized software applications and analysis methods, along with terabytes of data from trucking operations to produce a congestion impact ranking for each location.
Have your say
This is a moderated forum. Comments will no longer be published unless they are accompanied by a first and last name and a verifiable email address. (Today's Trucking will not publish or share the email address.) Profane language and content deemed to be libelous, racist, or threatening in nature will not be published under any circumstances.