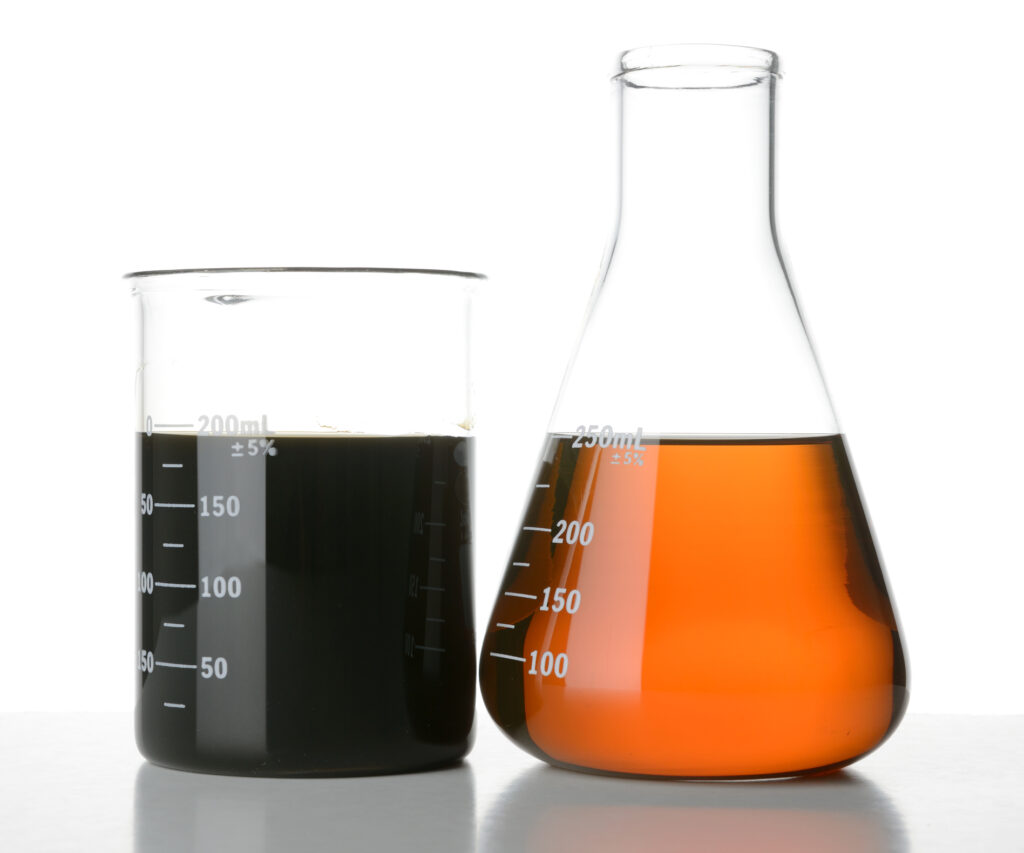
Understanding the dark art of engine oil analysis
Every oil analysis tells a story — and the plot is one of destruction under the hood. The related fluid samples identify the by-products of an explosive combustion process, the wear metals that shear away from component surfaces.
Iron might come from worn cylinders and camshafts, the chromium from piston rings. Silicon can be linked to abrasive sand sucked through the intake. Potassium might be associated with a coolant leak.
Left unchecked, they’re the type of issues that can lead to catastrophic engine failures.
As troublesome as individual readings appear, the full story only begins to emerge by considering related factors including the engine model, truck application, and even specific fluids in the sump. After all, seemingly high potassium levels might actually be traced to a preferred oil formula unless there’s a corresponding spike in sodium.
“Spike” is the operative word, too. Given the many factors involved, an effective oil analysis program focuses on trends and changes more than any individual readings. It’s a matter of comparing reports to earlier fluid samples, or against benchmarks that reflect the same engine models in similar applications.
Complete every line on the form
It explains why something as simple as the blank cell on a form can lead a program astray.
Stede Granger, OEM technical services manager for Shell Lubricants, stresses the need to ensure that every field of information is populated – including the date, equipment mileage, or type of oil being used.
“The biggest issue with oil sampling today is the technician does not get a total amount of data on the label.”
– Ron LeBlanc, Petro-Canada Lubricants
“The biggest issue with oil sampling today is the technician does not get a total amount of data on the label,” agrees Ron LeBlanc, senior technical advisor at Petro-Canada Lubricants. The engine model and fleet name might be right, but the mileage forgotten. “That happens a lot.” And such data is crucial when projecting a drain interval.
It’s why some of today’s oil analysis programs look to address these challenges by collecting data through smartphone apps, and pre-populating data fields.
“What companies don’t realize is that the feedback comments and flagging limits are based on comparisons and trending data,” says Jason D. Gerig, lubricants services sector manager for Chevron Lubricants – Americas. Failing to match the make and model to the chosen type and grade of lubricant can lead to unnecessary repairs.
Get a clean, oily sample
A consistent approach to actually collecting the oil sample will play its own role in ensuring trustworthy results.
Any sample should be collected mid stream, a few seconds after the drain plug is removed, LeBlanc says. Another option is to siphon the oil through the dipstick tube, although there’s the threat of condensation if the engine is running cold. The cleanest sample of all will involve using a dedicated sample port — a feature widely adopted by test fleets.
Granger also stresses the importance of collecting oil from a warm engine with full oil galleries to ensure a homogenous mixture. Soot will gradually drop to the bottom of a sump, so the related readings might appear to be overly concentrated if the oil is drawn from the first drops to emerge from an engine that has been parked for awhile.
No cause for alarm
While some of the earliest readings from brand new engines may seem alarming, they aren’t always a cause for concern.
Copper readings of 200-400 parts per million are often associated with leaching from a new oil cooler, LeBlanc says as an example. And elevated levels of sodium and potassium might exist because some exhaust gas recirculation (EGR) coolers don’t immediately seal, he says. Such readings tend to normalize after three or four oil change intervals, so the EGR valves only need to be resealed if the levels remain stubbornly high.
Early samples can also include elevated aluminum and potassium. While such readings could indicate wear metals and coolant leaks when examining later oil samples, the early spikes are likely coming from the intake manifold and charge air cooler, Granger says, referring to brazing flux used in the manufacturing process.
“Before I make a conclusion on oil analysis, I like to see two or more items agree with the conclusion.”
– Stede Granger, Shell Lubricants
New liners and piston rings, meanwhile, can still generate elevated iron levels from the liner and a slight increase in chromium from the rings, LeBlanc adds. But this is another example of data that will vary by engine model. Some equipment will break in within 65-95,000 km. Other models take longer.
Setting such readings aside, most of today’s engines arrive and run much cleaner than their predecessors ever did.
“The majority of the OEM engines out there, when they come from the factory and they’re put into service, they’re really impressive,” LeBlanc says. “They do not have elevated or high wear metals – even from Day 1 they are very efficient.”
Look at combined readings
Gerig admits it can be a challenge to identify the specific source of elevated readings that emerge in an oil analysis report. But it is possible.
“Particle contamination is the Number 1 cause of lubricant-related failure, and external contaminates like dirt can be a contributing factor to wear,” he says.
Granger remembers reviewing a teardown of a work truck that reported such levels, and ultimately sacrificed the rings. “If that had been caught early with oil analysis, they could have saved the life of the engine.”
Each reading from an engine oil analysis tells part of a story, but it’s often a combination of readings that can point to a specific source of the contamination.
“Before I make a conclusion on oil analysis, I like to see two or more items agree with the conclusion,” Granger explains. “Every once in awhile they’ll have a flyer — a data point that just doesn’t make sense.”
Elevated iron readings, without any chrome wear, would suggest an issue with an accessory drive gear, LeBlanc says as an example. If wear metals associated with an engine’s pistons and cylinders are accompanied by higher levels of silicate, the problem may be an air intake hose on the suction side of the turbo ingesting high volumes of dirt.
Monitor the fluid condition
While the fluid’s viscosity doesn’t tell the entire story, it does point to issues like fuel dilution, and whether the oil is beginning to oxidize, Granger adds.
A 1540 oil should have a viscosity of around 13-15 centistokes, but 10 centistokes could be a sign of trouble. If the lab tech turns to fuel dilution and sees a reading of about 5%, the combined information might point to a bad injector.
Meanwhile, high potassium levels, when combined with a spike in sodium, can reflect a possible coolant leak. But Chevron oils also incorporate high levels of potassium. That makes it important to consider other issues like changes in viscosity, oxidation, and wear metals before chasing down a coolant leak, Gerig says.
“Typically, by the time coolant shows up in the used oil analysis report, it is too late. Many times, cooling system problems like overheating can be identified first through coolant analysis,” he says.
Other readings can be associated with the preferred oil itself. Phosphorous and zinc, for example, can be traced to an anti-wear formula known as ZDDP. Detergent-dispersing additives can manifest themselves as calcium and zinc. Many formulas also contain boron.
“Not all oil manufacturers use the same combinations,” LeBlanc says.
It reinforces the need to ensure the sample is submitted with exact information about the oil in the container.
Broader benchmarks
As important as it is to measure an engine against its previous experience, it’s also a good idea to compare results to broader benchmarks, including identical engine models in similar applications. You don’t always have to collect two or three years of data to determine what readings are “normal”. Labs will often provide numbers for comparisons.
LeBlanc, however, stresses the need to be careful when comparing any data. The wear associated with a typical 80,000-lb. gross vehicle weight can differ from a GVW of 129,000 lb., he notes.
“We always have to look at application, we have to look at oil that the customer is using, the service duty, the filters, all of the data that helps us interpret that oil analysis.”
Changes over time
Assumptions about the readings also need to evolve along with the engines and oil formulas themselves.
“We are seeing much lower levels of iron, generally, in the engine oil as these engines are better designed and manufactured,” Granger says. Twenty years ago it wasn’t uncommon to find 600 ppm of iron in the oil. Today, readings of 60 ppm can raise alarm bells.
“The environment inside the crankcase is so much milder,” he says, referring to the benefits that emerged with Selective Catalytic Reduction (SCR) and the urea supplies that offset work that was once left to exhaust gas recirculation. The oils are more effective, too.
Gerig, meanwhile, refers to a general shift away from using Total Base Number (TBN) in favor of Acid Numbers (AN) as a way to measure oil condition. “In the past, we saw stronger and higher levels of sulfuric acids in the engine oil, which required the measurement of TBN, where now with the lower sulfur in fuel and new additive technology in CK-4 engine oils, TBN is not as relevant. Acid number measurement is now replacing TBN along with oxidation, viscosity, and wear metals to monitor diesel engine oil condition.”
Diesel that once contained up to 500 ppm of sulfur led to the sulfuric acid that damaged bearings, Granger explains. Today’s limits are closer to 15 ppm.
Things change. But the value of monitoring the oil remains.
Have your say
This is a moderated forum. Comments will no longer be published unless they are accompanied by a first and last name and a verifiable email address. (Today's Trucking will not publish or share the email address.) Profane language and content deemed to be libelous, racist, or threatening in nature will not be published under any circumstances.
Very informative. Thank you.
I agree with you. I had a 2001 Detroit Diesel Series 60. I used Amsoil 5/30, nano fibre oil filters & a dual bypass oil filter system. It was getting approx 10 ppm iron continuously, over 10,000km, but jumped to 20 ppm on one occasion. The lab recommended resampling at next change. I took it to Cullen Detroit Diesel & they determined a cam follower had seized & was scoring the cam. For under $3000.00 , I was back on the road & not out a full engine, which could have happened. The trend & spikes are great indicators. Your observation about oil coolers is spot on. Another engine had high copper levels for the first few changes, but settled down. Oil sampling is an expense, but that one incident more than paid for all vehicle samples. The only thing oil analysis doesn’t seem to predict is catastrophic failure, or the need for new main & connecting bearings, at higher mileage