Collisions drop almost 16% in Canada, US since 2024: Geotab
Commercial vehicle collision rates across North America fell 15.8% between 2024 and 2025, but the improvement was mostly driven by gains in the United States, according to Geotab’s 2026 State of Commercial Transportation report.
The data shows collisions in the U.S. declined 18.3% over the two-year period, helping offset stagnant performance in Canada, where the collision rate per million miles has remained unchanged.
However, the report says that North America – Canada and the United States – remains the safest region analyzed in the study, outperforming Latin America and Europe.
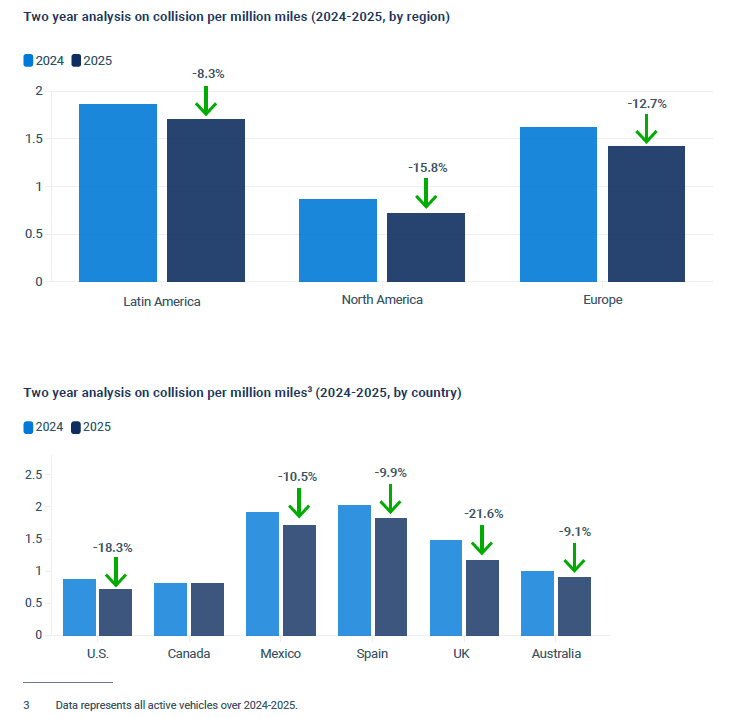
The improvement over the past two years is part of a bigger picture, as collisions per million miles declined by 38.7% across the United States and Canada between 2021 and 2025.
Released Feb. 26, the report is based on nearly 6 million connected vehicle subscriptions and 100 billion daily data points. It provides a detailed look at safety trends, insight into electrification trends, as well as asset maintenance and management challenges and patterns.
Geotab says that the findings prove that telematics use and internal discipline and commitment to safety can help fleets achieve significant results – on a global scale, active Geotab users achieved a total of 28.7% collision reduction rate, compared to non-users.
However, significant safety risks remain.
Safety risks drive up premiums
The riskiest 10% of drivers (those with the highest average Predicted Collision Risk scores in Q1 2025) account for one in five collisions and are 7.4 times more likely to crash than the safest drivers with the lowest PCR scores. Severe speeding — defined as driving 20% above the posted limit — increases collision probability sevenfold within just five seconds. Overall, speeding was fund to be present in 22.2% of all collisions.
Geotab says that while the collision frequency is declining, the crashes that do happen cost more than ever, as higher vehicle repair costs, medical expenses, local litigation trends and nuclear verdict exposure continue to drive insurance premiums upward across North America.
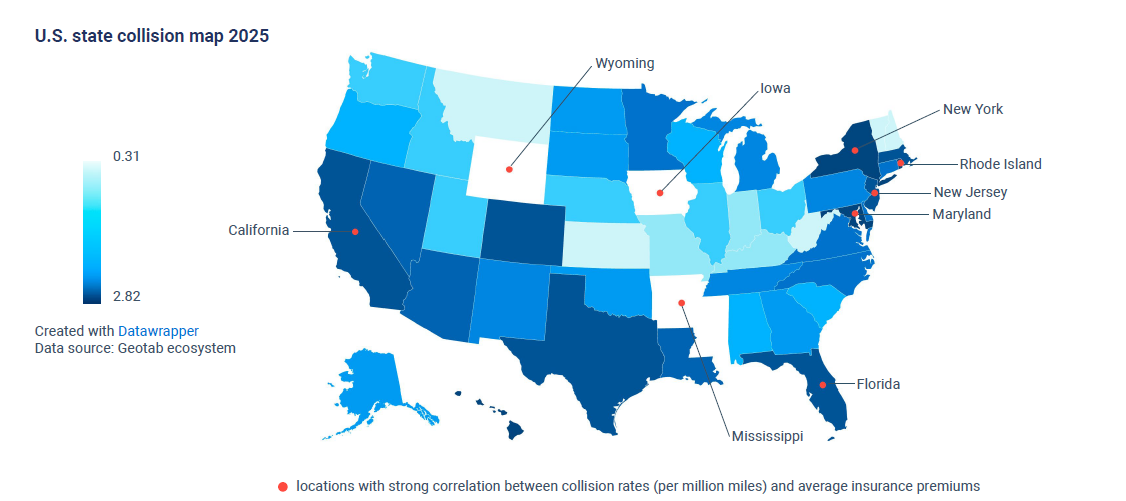
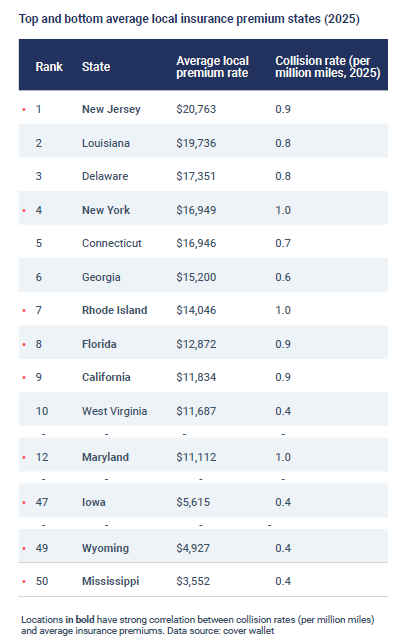
Comparing Geotab collision data against average premiums reveals the correlation — New Jersey ranks as the most expensive state for premiums and has the sixth-highest collision rate among Geotab’s U.S. fleet customers. Meanwhile, New York ranks second in collision risk and fourth in premiums. Average premiums in both states are $20,763 and $16,949 respectively, with collision rates of 0.9 and 1 per million miles.
Meanwhile, states such as Mississippi, Wyoming and Iowa have some of the lowest average premiums, between roughly $3,500 and $5,600, and report collision rates of 0.4 per million miles.
But Geotab adds that a reduction in collision frequency can help adjust the premiums in favor of fleets; the rates are also based on geographic risk exposure and legal environments in areas of operation.
Have your say
This is a moderated forum. Comments will no longer be published unless they are accompanied by a first and last name and a verifiable email address. (Today's Trucking will not publish or share the email address.) Profane language and content deemed to be libelous, racist, or threatening in nature will not be published under any circumstances.